


Last week, the U.S. Census Bureau released its first set of data from the 2020 Census. The data determines the number of U.S. House districts that each state is given. This process known as “apportionment,” is the first step in redistricting, the creation of political maps.
The numbers released tell us the total population living in the United States as well as federal employees stationed abroad and members of the armed forces. After each census, the new population counts are used to decide the number of representatives that each state in the country receives. By federal law, the size of the House of Representatives is set at 435 seats. The growth or loss of population size in a state affects whether a state gains or loses a seat in the House of Representatives.
This year, seven seats in the U.S. House will shift among thirteen states. States gaining a congressional seat include Texas, Colorado, Florida, Montana, North Carolina, and Oregon. California, Illinois, Michigan, New York, Ohio, Pennsylvania, and West Virginia will all lose a seat.
The apportionment data is the first step in the redistricting process, but more census data is needed before map drawing can begin. Redistricting Data Files will be released no later than September 30th, 2021 and will have detailed population characteristics like race, Hispanic origin, voting age, and more. These files will be used by states and local communities to draw the districts for Congress, state legislative districts, city councils, and school boards.
The 2020 Census faced enormous challenges because of the COVID -19 pandemic, natural disasters, and political pressure. The League supported moving the deadlines for collecting and reporting on census data to adjust to these challenges through advocacy and litigation.
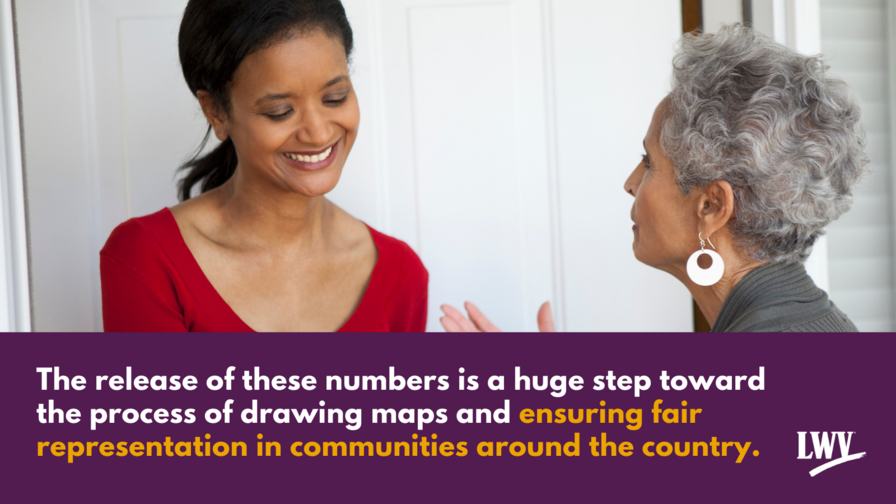
While we will not know the effects of the challenges that census faced until more data is released, we should celebrate the release of the apportionment data as we look forward to the additional data in the fall. The release of these numbers is a huge step toward the process of drawing maps and ensuring fair representation in communities around the country.